from wiki:
- For each data point, a number of lines are plotted going through it, all at different angles. These are shown here as solid lines.
- For each solid line a line is plotted which is perpendicular to it and which intersects the origin. These are shown as dashed lines.
- The length (i.e. perpendicular distance to the origin) and angle of each dashed line is measured. In the diagram above, the results are shown in tables.
- This is repeated for each data point.
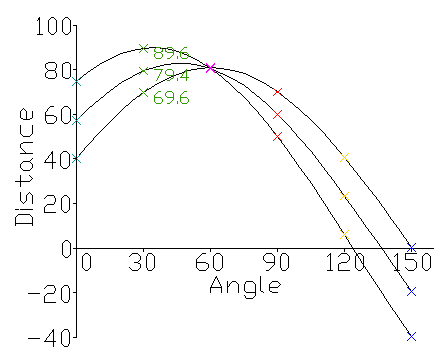
- A graph of the line lengths for each angle, known as a Hough space graph, is then created.

No comments:
Post a Comment